30Apr
Chapter 1
The Problem
Introduction
Two of the main reasons for fitness testing is to promote healthy lifestyle and physical exercise. Both are usually done in the school setting incorporated in the Physical Education curriculum from Grade school until Higher Education. One of the fitness tests that schools are repeatedly implementing is the 3-minute step test. This test is a popular method for estimating the aerobic capacity (Bates et al., 2015). Instead of adhering to the individual differences, the said test method is still used by teachers to generalize assessments due to the large number of pupils in each classroom, which has resulted in mishaps caused by instructor error, student error, and lastly technical risks (Podstawski et. al., 2015). These mishaps contradict the Principle of Individual Differences, which asserts that every individual's reaction to an exercise regimen is unique (Gill et. al., 2017).
Accordingly, one drawback of a higher step is that persons who are taller will find the step height less difficult because of their longer limbs. This is due to biomechanical differences (Nguyen and Gillum, 2015). While individual difference is a universally established concept, the gap of the study perceived vague equality when fitness tests such as the step test disregard individual differences. Undeterred by this perceived gap, the biomechanical individual differences are used in this study.
Despite the popularity of exercise intensity as an independent variable in weight loss-related studies (Botero et al., 2014; De Feo, 2013; Swift et al., 2014;), it is not commonly investigated as dependent variable. This study’s gap focuses on the little to no importance given to exercise intensity in planning for practical assessments before implementation. Even in obese individuals, although, regular exercise can improve metabolism disorders but the specific exercise intensity still needs to be discovered (Ruan et al. 2023). In relation, the researcher assumes that fitness assessment disparities will persist due to individual differences in body structure and anthropometry, which are not well understood and considered in exercise physiological responses.
Fitness testing is used as a learning context by physical educators even if there is not enough data to support its value (Alfrey and Gard, 2019). Concomitant to this, the present study aimed to establish empirical evidence demonstrating that leg length and weight can predict step test performance, which may pose practical implications for the fitness assessment practices of PE teachers. An ethical test user's duty in PE is to ensure a favorable testing experience (Baumgartner et al., 2015).
Therefore, this study examined the leg length and body weight influencing exercise intensity in step test performance using a descriptive correlational design. This study intended to find the influence of leg length and weight to exercise intensity to strengthen the idea of safety precautions before conducting a fitness test that requires these variables.
Theoretical and Conceptual Framework
The study assumed that leg length and weight influence the participants’ exercise intensity. This study is anchored on the Biomechanical Principles of Range of Motion and Ground Reaction Force (Knudson, 2021). In the context of this study, the anthropometric values of leg length and weight are the two independent variables, while exercise intensity serves as the dependent variable. Anthropometry measures human attributes to understand physical variance (Kanwar, 2017; Singh et al., 2017). It is also called as noninvasive quantitative measurements of the body (Casadei and Kiel, 2019), and it is considered as subfield of morphometry, a study of the size, shape, and population fluctuations of the constituent parts of biological forms (Utkualp and Ercan, 2015).
Considering the above-mentioned assumption, this research is based on the sources of variation and argument that leg length and weight are indicators of exercise intensity in the step test as evaluated by heart rate. Individuals with a shorter leg length and a greater body mass tend to exert more muscular effort, resulting to increased heart rate. In contrast, those with longer legs and a lighter body mass tend to exert less muscular effort, which has a relative influence on heart rate levels.
The biomechanical characteristics change from individual to individual (Sharma et al., 2014). The prefix "bio" suggests that biomechanics is related to biological or living systems. The investigation of forces and their effects is implied by the root word “mechanics”. Combining both, biomechanics refers to the study of forces and how they affect humans, as well as how forces applied by humans affect them (Latash and Zatsiorsky, 2015). In this study, the Biomechanical Principle of Range of Motion is applied. Pallarés and colleagues (2021) defined the principle as the joint's normal range of motion, which includes movement before, during, and after an execution. Range of motion is the angular motion in degrees between the start and finish positions of a motion, which may be determined using static or video pictures of a joint (Andersen et al., 2020). The Range of Motion (ROM) Principle asserts that less ROM is preferable for low-effort and high-accuracy actions, whereas full ROM encourages speed and force (Hazari et al., 2021). With this, the researcher assumed an increase in heart rate as a physiological response to the exertion of muscular force for individuals with shorter leg lengths as they step on a riser using full ROM. Moreover, a step on a bench is against the earth's gravitational pull. Considering the Ground Reaction Force (GRF) (Toda et al., 2015), large body mass is at a disadvantageous circumstance because it is required to produce a force of equal magnitude against the ground (Dali et al., 2013). Increased heart rate is only a natural physiological response to exerting muscular force. With the step test protocols, the measure of the test constitutes to exercise heart rate.
Quite the opposite of the previously mentioned principle, the Ground Reaction Force is Newton's Third Law of Motion which is anchored to Action Reaction Force. Clinicians frequently use ground reaction force (GRF) measurement to gauge and examine human locomotion (Horsak and colleagues, 2020). The force that the ground applies to a body through touch is known as Ground Reaction Force (GRF). This force portrays that when the leg pushes the ground down and backward, the Ground Reaction Force pushes the entire body up and forward, while the vector inclination confronts the movement (Neves, 2021). When an individual is at rest, Ground reaction force data were normalized to body weight. According to Matijevich and colleagues (2019), this response is explained as the force that the ground exerts on a body that is in contact with it, the GRF rises as a result of acceleration forces that arise during motion.
Leg length is a key physical attribute and crucial in determining physical capabilities and performance especially in sports and physical activities. Kriswanto and colleagues (2021) and Clark (2022) indicated that longer legs can influence energy expenditure and efficiency in activities like running. Subsequently, Zaccagni et al. (2019) suggested that shorter leg lengths may offer advantages in certain sports such as gymnastics and football particularly in quick dribbling. Hence, leg length not only contributes to an individual's physical stature but also significantly affects their athletic and functional abilities. Variations in physiological characteristics are especially noticeable in children (Pinzone et al., 2016), giving taller and more athletic individuals an edge in fitness and sports performance such as running performance to the upper leg, total leg, and total leg-to-body height ratio (Mooses et al., 2015).
Debaere and colleagues (2013) also employed leg length as a performance measure for high-level sprinting among men and women, where they found a high correlation between men's leg length and step length. However, when walking or running, Pinzone et al. (2016) surmised that variations in stride length and cadence can be attributed to population height variability. By this action, differences in mass and segmental inertia moments may likely influence force, moment, and power measurements (Simonsen and Alkjaer, 2012). However, it is still unclear how physiological characteristics like weight and leg length relate to the intensity of exercise (Meghan et al., 2022). It should follow logically that physiological traits can influence the intensity of exercise.
Meanwhile, weight is a crucial physiological measure that can impact various aspects of life and performance. Its role as a predictor of aerobic performance is conflicting (Rauner et al., 2013). In physical activities, research shows that weight can affect participation and outcomes, highlighting the complexity of its impact on physical exercise and overall health (Azagba et al., 2014; Yoshimura et al., 2022). Furthermore, studies in sports science (Ab Razak et al., 2022; Verbecque et al., 2022) demonstrate weight's influence on athletic abilities like strength and endurance, underscoring its importance in both everyday life and specialized activities.
Moreover, exercise intensity, a key factor in aerobic training, is crucial for affecting health outcomes and is typically gauged using the Percent Heart Rate Reserve (%HRR) method (Hansen et al., 2022). This method involves calculating the difference between a person's maximal heart rate (Maximal HR) and resting heart rate (Resting HR) to determine the HRR (Hung et al., 2018). The target heart rate (Target HR) for a desired exercise intensity is then calculated by multiplying the HRR by the desired intensity percentage such as 60% for moderate intensity, and adding the Resting HR back in. Thus, the formula for 60% moderate intensity is Target HR = (HRR × 0.60) + Resting HR. This approach, highlighted by Weatherwax et al. (2021) and Taylor et al. (2019), ensures that workouts are designed to be effective and safe if intensity to individual cardiovascular capacity, health conditions, and training goals are observed and properly executed.
In addition, a higher step height raises the risk of injury because of the constant ground reaction force (Nguyen and Gillum, 2015). Putting emphasis on this to an obese children, their weight when they are walking is strongly correlated with impact force, while lean mass helps to reduce impact force (Villarrasa-Sapiña et al., 2017). In Physics, when a body is in contact with the ground (not a free-falling object), force is reflected against the body as a reaction, which is just another name for weight. When a person remains motionless, the ground reaction force equals the person's mass multiplied by the gravitational acceleration (F = m x g) (DeLisi, 2019). This concept implies that lighter and leaner individuals have more advantages in performing the step test.
In most of the studies, exercise intensity plays the independent variable, however, every single person needs not to choose but to find what category of exercise intensity may he/she belongs to promote safety in fitness testing. The researcher was prompted to consider fitness evaluation procedures to help students perform their task well in their zone of intensity.
Figure 1 shows the conceptual framework of the study. In the illustration of the relationship of the concepts, leg length and weight are the predicting variables while exercise intensity is the outcome variable. The study aimed to determine the influence of the two predicting variables.
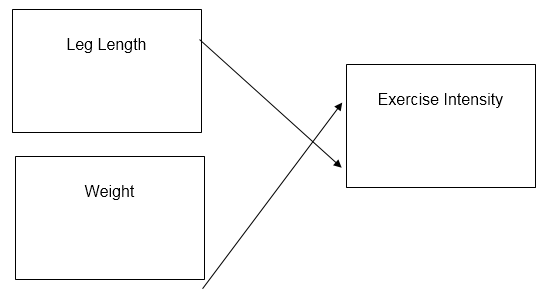
Figure 1: Interplay of Variables in the Study
Statement of the Problem
Considering the assumption of this study which is the leg length and weight are sources of variation in the participants’ exercise intensity, the following research questions were formulated:
1. What are the participants’ leg length and weight measures?
2. What is the level of the participants’ exercise intensity measure after 3 minutes step test performance?
3. Do the participants’ leg length and weight significantly influence their exercise intensity?
Null Hypothesis
Problems 1 and 3 are hypotheses-free. In Problem 2, the null hypothesis is formulated and tested at a .05 level of significance:
Ho1: The participants’ leg length and weight do not significantly influence their exercise intensity.
Significance of the Study
The following sectors may benefit the findings of this study:
Physical Educators. They can benefit from this study by understanding the biomechanical concept in performing step test and by modifying their strategies and approaches in teaching fitness test to include the curricular agenda on safety procedures of physical fitness evaluation.
Sports Coaches. They can benefit from this study by incorporating the different factors to consider when planning a holistic exercise program and creating practical innovations to improve the athletes' skills during the training session. It can help them create a training plan that is sufficiently tailored to the type of training design they have selected to yield results that are more in line with their expectations.
Fitness Instructors. These professionals may use the study’s findings to come up with a better and safer result for physical fitness to their client that involves leg length and weight in cardiorespiratory exercises. They can create their current personalized workout regimen, which requires thorough pre-assessment to precisely predict the person's results and the type of exercise.
PE Learners. These students, from elementary to college level, can benefit by receiving equity and appropriateness in the practical assessment. The students can maximize their ability to positively perceive the subject as an open room to improve their skills and knowledge of the different sciences that would explain how the human body moves. It is to make students realize that there's always an open space that caters to their differences.
Curriculum Developers. They can benefit from this study by making some modifications and adjustments to the content to make the PE curriculum more inclusive that is more likely advantageous to students. This study can inspire innovative learning activities and content integration into existing curriculum, promoting holistic student development and eliminating inequality for those unable to reach standardized practical assessments.
Instructional Material Designers. These are the experts in adjusting the learning assessments when one does not work with a particular group of students. They can benefit from this study by utilizing the results and recommendations as a reference in interpreting the scores acquired by the students so they would receive appropriate scores inside the zone of their abilities.
Scope and Delimitation of the Study
The study intended to determine the influence of leg length (in centimeters), weight (in kilograms) on exercise intensity (in heart rate beats per minute). The study utilized only one fitness test, which is the 3-minute step test. It is only limited to college students, who were enrolled to tertiary Physical Education courses or PATH-FIT. The study did not include participants who were beginners to fitness testing and those who were not physically active. Hence, the sampling technique is purposeful sampling. The study is limited only on the leg length and weight variables excluding the medical history, height, diet and bone or muscle density which also serve as the contributing factors in performing the step test. The study maintained a metronome set at 96 beats per minute for 1 minute only, without altering it based on the participants' abilities.
Definition of Terms
This section defines the terms conceptually and operationally. This would guide readers in understanding the concepts of a certain word being used in the study.
Exercise intensity. Exercise intensity is determined by how much energy is needed to complete a physical activity in a certain amount of time (Hills et. al. 2014). This term identifies the training stimulus for all individuals with different fitness levels (Wolpern et al., 2015). In this study, the intensity of performing a one-minute step test measured in heart rate beats per minute was classified based on the percentage of Heart Rate Reserve.
Leg length. This term refers to the distance between the foot tip and the origin of the corresponding hip joint (Liu et al., 2011). In this study, the distance from the anterior superior iliac spine (ASIS) to the medial malleolus was measured using a tape measure while the participant was lying supine, classified based on class norms as very short, short, moderately long, long, and very long.
Weight. This term refers to the data of a person gathered through a weighing scale in a kilogram unit (Cameron, 2022). In this study, the participant's body mass was measured using a weighing scale in kilograms that is classified based on class norms as very light, light, regular, and heavy.
Chapter 2
REVIEW OF RELATED LITERATURE AND STUDIES
This chapter supports the present study based on the outcomes of other researches. It contains related studies focusing on the exercise intensity, leg length, and weight of a person that affects physical activity performance.
Exercise Intensity
Exercise intensity is one of the primary factors to consider in planning to implement exercises. The exercise intensity is subjective since not everyone has the same endurance or strength to undergo different activities (Julius et. al., 2012). The most common way of getting the target heart rate or for the training zone is the Karvonen formula. However, the study of She et al. (2015) reckoned that the said formula might not be suitable for all age groups. Findings of their study showed the inverse relationship between BMI and heart rate. This implies that the more significant the BMI is, the slower the heart rate increases since the workload also increases.
Wolpern and team (2015) suggested that establishing exercise intensity might better identify the lowest effective training stimulus for all individuals with varying fitness levels. Because of this, many studies have come up with methods to estimate exercise intensity. Svensson and team (2017) opposed She and team (2015) since the study was focused on the obese individual, which states that moderate-intensity training significantly increased aerobic capacity and reduced weight, while high-intensity training improved the health-related quality of life of obese people.
Similarly, Cockcroft and team (2015) showed that high-intensity interval exercise (HIIE) may offer a time-efficient in improving health outcomes as compared to those who are doing the moderate-intensity exercise (MIE) among the normal-weight adolescent males. Pimenta and team's (2019) study supports the effectiveness of HIIT and MIE as cardiovascular health indicators, indicating low risk and low mortality rates.
However, it is not all the time that higher exercise intensity can benefit people, especially those with nocturnal heart rate variability (the dominant marker of the occurrence of stroke). According to Myllymäki and team (2012), increased exercise intensity can delay recovery in people with nocturnal cardiac autonomic modulation (stroke) cases. This is dangerous since these markers usually happen in strong and healthy individuals.
Moreover, there are studies of exercise intensity that are related to professional athletes during their training sessions. Most representative studies show the positive effects of weighted squat (resistance) training on athletes' performance in jump height, rate of force development, response time, maximal power, and maximal speed. The lower limbs are the ideal area to focus on as the exercises become more intense (Xie et al., 2022). This study is being agreed upon based on the result, which states that there were significant increases in weight and body mass index following resistance exercises. Based on this, the study proposed that the modality is crucial for formulating and carrying out prescriptions when aiming to modify risk factors in individuals (Thomas et al., 2022).
Furthermore, in the study of Scribbans and team (2016), they found that low training doses at higher exercise intensities can increase maximal oxygen levels in young and highly active adults. In the context of sports, a study of Hwang et al. (2022) among professional soccer players suggests that low-intensity exercise sessions must be individualized giving more focus on re-metabolized energy to improve recovery ability. According to Kawae and team (2022), a lack of time to engage in physical activities is a barrier to exercise. Hence, a study on ‘Gear’ Exercise Programme created an exercise design suitable for busy working individuals. The said design is a public health initiative to promote exercise in clinical, home, and work environments because it is a time-efficient exercise intervention.
Therefore, the studies related to exercise intensity apparently show that this variable can be affected in so many factors or areas in the human body. It has been concluded in the above-mentioned literatures that exercise intensity can either influence or be influenced by the different variables. All of it falls to fitness which considers the recovery pace of a person based on their exercise intensity. To sum up, the higher the exercise intensity, the faster the recovery. These may help to support the assumption of this study.
Leg Length
People have various measurements of leg length based on their physical proportions. This can affect the execution of the performance in sports and other recreational activities that involves qualities of lower limbs. Kolokoltsev and others (2021) state that the development of body growth is influenced by the changing living conditions of the individual, which may accelerate or delay the development in adolescence, where the final type of the human constitution is formed. The study suggested the necessity to include body somatotypes among students before conducting physical exercises in schools. In the same study, Kolokoltsev et al. (2022) revealed that girls aged 18 tend to change to modern girls' physiques. The number of examined long-legged girls increased by 5.2 times, while the number of short-legged girls experienced a 2.5 times slower rate of sexual development.
Furthermore, childhood environmental conditions are believed to significantly influence adult leg and trunk length (Liu et al., 2014). It is observed that the effect of shorter leg length suggests that LLHR (leg-length to hip ratio) might be a marker for the development of cardiometabolic disorders in children. Supporting this study, Khajooei and team (2022) found that participants decreased knee and hip flexion to maintain effective leg length and upright posture, ensuring an adequate reaction to upcoming perturbations. Therefore, the findings enable PE teachers and coaches to establish a foundation for pedagogical approaches in physical education.
Consequently, O'Brien and colleagues (2018) discovered that individuals with longer legs or greater heights require a reduced number of steps to attain a specific level of walking intensity. The study supports the idea that longer stride lengths require less exertion to cover the same distance, potentially leading to a higher perception of exercise intensity. Stefan and colleagues (2016) noted the link between short stature and higher cardiovascular risk, suggesting that individuals with longer stature (and by extension, longer legs) might have a physiological advantage in physical activities. They exert less cardiovascular effort for the same activity level compared to those with shorter legs, translating to lower exercise intensity.
In another context, a study of Kriswanto et al. (2021) described the effect of leg length on improving short distance running (sprint) performance. The study inferred that leg length is an independent predictor of energy expenditure, which means that the longer the leg, the lesser the energy expenditure but would increase walking speed.
Moreover, a person's body structure affects every activity in sports because it is usually related to physical ability or strength (Clark, 2022). Body dimensions interplay with the ground contact time because the moment of inertia is proportional to the mass and length of the leg. According to Margono and team (2018), students with short-leg lengths do not have the same abilities as those with a long-leg length in 60m sprint. Hence, the difference in measurement of leg length has an impact on the running speed.
Most exercises require leg work, which is an advantage for people with longer leg lengths. However, this study contradicts Zaccagni and team (2019). They asserted that a shorter foot in males and a shorter leg in females may be advantageous for the best sprint performance. Based on the anthropometric point of view, the fastest female athletes have short legs and feet (in the tarsal and metatarsal areas), while the fastest male athletes have wide hips with a quick and high feet. Furthermore, another supporting study claims that statement is in the field of Judo competitors. According to Jagiełło (2013), lightweight categories are characterized by a strong type of body build, stout or obese, with an average length of lower limbs based on Manouvrier’s index.
A study in Asia (Lee, 2019) found that the height and leg length of Asians when standing may affect their physiological response in the step test, therefore, differences in heart rate and oxygen consumption can potentially affect the model's (3 MPKS test) prediction. When this happens, the individuals' sports and physical activity performance are also being affected. Due to locomotor deviations relevant injuries will arise during the commissions. The influence of leg length on athletic performance, health consequences, and physical development is subject to considerable regional variation (Kolokoltsev et al., 2021, 2022; Liu et al., 2014; Khajooei et al., 2022; Kriswanto et al., 2021; Clark, 2022; Margono et al., 2018; Zaccagni et al., 2019; Jagieʂʂo, 2013; Lee, 2019).
The pre-assumption of the people falls mostly to the longer leg length when sports-related activities are the concerns. However, based on the abovementioned studies, the short ones can also be an advantage. Therefore, regardless of the measurement of leg length, it can be still taken as an advantage to some people who have embraced their anthropometric aspects. These studies can be utilized as a reference in understanding the data of this study. The study highlights the need for a more comprehensive understanding of leg length measurements, considering geographical and biological factors.
Weight
Studies were conducted regarding body weight as one of the factors that would affect the outcome of different activities. For example, Sardinha and team (2014) explained the effect of weight on academic achievement in school. The results show that normal-weighted students (7th grade) are more likely to perform better at school regardless of their birth year. These disruptive findings are due to differences in BMI. The study suggests that schools should reinforce more physical activities for the students to improve their cardiorespiratory and weight status. However, Rauner and team (2013) exclaimed that weight is not a significant predictor of academic performance but for aerobic fitness. The data show that those aerobically fit students have more incredible difficulty passing Math and Reading Test than non-aerobically fit students.
In a social aspect, Azagba et al. (2014) emphasized the impact of weight on engagement in physical exercise, which is influenced by both self-perception and societal attitudes. Due to a lack of motivation and an overwhelming number of personal obligations, physical inactivity is common in society. In conclusion, the study infers how weight influences physical activity participation, which helps to explain the global epidemic of body shaming.
Furthermore, Yoshimura et al. (2022) created a smartphone app as an intervention meant solely for weekend workouts because the study's participants are employees. Increased physical activity is evident from the results, particularly on weekends. It did not, however, result in more weight loss. The effect was attributed to the intervention not focusing on cardiovascular fitness, which strongly leads to weight loss.
In the field of skill development in softball, a study investigated the influence of weight on performance, denoting that body weight can influence muscular strength (Ab Razak et al., 2022). A strong relationship between trunk rotation strength and throwing (power) ball velocity was found. On the other hand, a study investigated power in softball (Verbecque et al., 2022), indicating that body weight can influence a child's speed, endurance, and power. The study found that underweight children outperformed normal-weight children in agility and muscular endurance tasks, but performed poorly in muscular power tasks, rejecting the hypothesis that underweight children have greater muscle strength.
BMI has been widely used as a standard measurement of weight among people. Emara et al. (2020) surmised that increasing BMI leads to decreased visual dependence on balance, indicating a high reliance on the vestibular system, resulting in poor motor activity. This finding is inconsonance with the study of Hellstrom and Folke (2019) who explicated that weight affects walking speed measurement. In different perspective from the above, in a study of Muller & Maughan (2013), BMI cannot be used to characterize body composition. The purpose of the study is for gravitational sports (in which body weight influences performance). Therefore, the study suggests that there must be an accurate way of measuring body composition rather than BMI. The results of these two studies appear to be contradicting with each other. The study Emara et al. (2020) showed different results since the participants are elderly obese people, which is far from the population being studied by Muller & Maughan (2013), which are athletes of weight-sensitive sports.
The body weight of a person can play a lot of roles in daily physical activities and sports-related areas. This variable is relative to each person depending on how it may be used. It may be a hindrance to an average person to have higher BMI but an advantage to weight-sensitive athletes. The body weight has also been an issue until one will suffer the diseases due to obesity. These related studies may contribute to this study in terms of supporting the result.
The Relationship Between Leg Length and Exercise Intensity
The result of the study conducted by O'Brien et al. (2018) acknowledged that significantly taller or longer-legged individuals will have to take fewer steps to achieve an intensity of 3000 steps/30 minutes. The primary purpose of his study was to identify step rates across a range of walking intensities for MPA and VPA using METs, BMI, height, and leg length as predictor variables of step rate thresholds. This study was conducted to address the lack of research focusing on leg length as a predictor of exercise intensity, similar to Wu’s et al. (2021) study that only considered height in determining step rate thresholds for intensity-related physical activity. Size cannot predict the measurement of legs accordingly (Wittenbecher et al., 2019) because it can be subdivided into the components such as: sitting height and leg length. Hence, height is dependent on the leg length as well.
Another study was conducted regarding the relationship between a person's longer or shorter stature and cardiovascular risk (Stefan et al., 2016). Short height increases cardiovascular risk, a major cause of mortality globally, while longer stature individuals benefit from longer stride lengths, resulting in less effort in physical activities.
In a study conducted by Salamuddin et al. (2014), gender disparities in the relationship between leg length and exercise intensity were assessed. The study suggests that while females tend to have a greater leg length, this relationship is inconsistent in males, particularly when walking at slower speeds. This suggests that gender differences in biomechanics and muscle mass distribution could influence this relationship. More so, the relationship between leg length and exercise intensity is evident in another study of Salamuddin, et al. (2014). In the female category, leg length emerged as an independent variable that predicts the energy expenditure. This means that for every increase in leg length, there is a corresponding decrease in energy expenditure. However, male participants showed a weak correlation between leg length and stride length frequency. This weak correlation indicates a relationship between leg length and stride length frequency.
The Relationship Between Weight and Exercise Intensity
The effects of being overweight on health-related physical fitness vary with the fitness component being examined. For instance, overweight adolescents tend to have poorer muscular endurance than normal-weight adolescents in cardiovascular fitness (Musálek et al., 2020). This finding is concurrent to the study of Deforche et al. (2013), which shows that obese subjects had poorer performances on weight-bearing tasks but did not have lower scores on all fitness components. To encourage physical activity in obese youth, actions should be tailored to their abilities.
Ding and Jiang (2020) found that students in the normal weight range performed better in cardiopulmonary function, speed, muscle strength, and endurance than their overweight and obese counterparts. Further study by Lopes et al. (2019) shows that better performances were attained by adolescents in the mid-range of the body mass index distribution, while performances of youth at the low and high ends of the body mass index distribution were lower.
These findings proved the recent study of Ding and Jiang (2020) on the relationship between BMI and Physical Fitness among University Students in China. Findings revealed that male participants with a higher BMI, needed more time to finish the running test as they had poorer cardiorespiratory endurance. However, the result may vary since the population included in this study is only male participants.
Some studies show why incapability is experienced among overweight or obese people. The study of Raistenskis et al. (2016) showed that obese and overweight children were less physically active and had lower physical fitness than normal-weight children. The study emphasizes the need for interventions to enhance physical activity and fitness in obese and overweight children to prevent injuries, as health risks are prevalent, particularly among obese adolescents. Becofsky and team (2015) added that among obese adolescents, elevated depressive symptoms are associated with poorer objectively measured cardiorespiratory fitness. Liu (2011) and Lopes et al. (2019) discovered that individuals who have a healthy weight exhibit superior performance across a range of physical fitness indicators, such as cardiopulmonary function and muscle strength. Overweight individuals may attribute their increased exercise intensity to the additional exertion needed to overcome their weight constraints. Ding and others (2020) identified a correlation between elevated body mass index (BMI) and diminished cardiorespiratory endurance in males. This implies that performing identical physical tasks demanded more time and effort than those performed by thinner individuals. This holds true to what Raistenskis and others (2016) observed that children who were overweight or obese engaged in less physical activity, thereby, possessing poorer levels of general fitness.
In such pursuit, it is important to understand that obese individuals experience greater ground reaction force during activities like walking because they need to put more effort in terms of their endurance (Nguyen & Gillum, 2015; Villarrasa-Sapiña et al., 2017). In this detail, ground reaction force is directly proportional to an individual's mass (DeLisi, 2019).
The related studies show the different solutions and new ways of strategies to solve the problems from the different areas of physical fitness test. Although some authors may disagree and agree with the existing conclusions, the study's importance makes it reasonable to investigate. These related readings serve as the foundation for this current study.
Chapter 3
RESEARCH METHODS
This chapter covers the procedures that were used to collect and interpret the data during the conduct of this research. Specifically, it describes the research design, study participants, sampling strategy, research instruments, validity and reliability of tools, data collection procedure, ethical considerations, and instrument implementation.
Research Design
This study utilized the descriptive correlational design to describe the influence of leg length and weight to the exercise intensity during the 3-minute step test. This design is being applied in this quantitative study so that, the elucidated data, in investigating the relationship between the interplaying variables, will be well defined. In line with this, the results of the study were described using the percentage of Heart Rate Reserve, which entails the zone of exercise intensity based on the anthropometry measurements of leg length and weight. Findings generated from correlational research can be used, for example, to inform decision-making, and to improve or initiate health-related activities or change (Curtis et al., 2016).
The collection and analysis of the data is the first and most crucial stage in addressing most research questions. This study collected data from a single group at one time. The paper obtained data from the cross-sectional implementation of the three-minute step test. Initially, the quantitative data (measures of the participants’ leg length, weight, and exercise intensity) were collected and analyzed so that the result would inform the researcher how they are related to each other. The purpose of quantitative data analysis is to provide more accurate estimates of relationships among predictors (Becker et al., 2016).
Participants and Sampling Procedure
The participants are college students between the ages of 18 and 20 from the schools in Gingoog City, Misamis Oriental. Approximately, there are 185 college students and 75 of these students are female, while 110 are male. The objective was to select a random sample that accurately represents 90 percent of the population. In order to attain the population coverage, the researcher selected a sample size of around 167 pupils (90 percent of 185). Consequently, the sample comprised around 68 female students (90 percent of 75) and 99 male students (90 percent of 110). The figure's ideal proportional representation of both genders was determined by considering their respective populations' sizes.
The study used a random sampling technique which substantially diminished the probability of bias in the research findings. A probability sample using random sampling is one in which each person has an equal and independent chance of being chosen for the sample (Setia, 2016). The application of probability-based sampling methods improves the dependability of the research by facilitating accurate computations of the ideal sample size, sampling error, and result precision. By employing this methodological approach, it becomes possible to get more precise conclusions and judgments on the target population of the study (Bhardwaj, 2019). In using this methodical strategy for participant selection, a more reliable and representative evaluation of the research inquiries is guaranteed.
The researcher, together with the PATH-FIT Instructors, segregated the profiles of the students who have cardiorespiratory medical histories, along with records showing tardiness leading to dropping the course and the differences in subject load for regular students because the data gathering procedures of the study took three to four hours. Then, a random sampling technique was implemented using the random number generator or an analogous instrument in order to guarantee an impartial selection procedure. Furthermore, each participant received a code for the random probability sampling procedure until the desirable sampling procedure was fit for the study. Hence, the researcher generated the data to control bias during sampling (Etikan & Bala, 2017).
Moreover, in situations where practical limitations occurred, such as student availability or class schedules, researcher experienced challenges in precisely achieving 90 percent representation, the objective was to approximate this percentage as closely as possible while upholding the random selection procedure. The selection of participants covers the health conditions, voluntary participation, and informed consent. High-risk students, those who declined to participate, and those who did not have parental consent were not included in the study.
Research Instruments
Two anthropometric measures were used, and a reduced-time step test protocol was adapted as instruments. This section expounds on the research instruments used in this study. The following were used to measure the variables:
Measuring Tape. This study is concerned with measuring leg length which is the distance from the anterior superior iliac spine (ASIS) to the medial malleolus using a measuring tape in unit centimeters.
Weighing Scale. The body weight was obtained using a digital weighing scale in unit of kilogram. The weight was taken twice per person to ensure consistency of result given by the weighing scale.
Three-minute step test protocol. The researcher utilized a modified version of the step test protocol in lieu of the existing such as the Harvard Step Test (Vangrunderbeek et al., 2013), Queen’s College Step Test (Bennett et al., 2016), and YMCA Three-Minute Step Test (Manadhar et al., 2021). The step test protocol follows the guidelines of YMCA 3-minute step test. A 12-inch step or bench was customized to 10-inch in 1-minute.
Pulse Oximeter. Heart rate was being measured by a pulse oximeter, a non-invasive medical instrument attached to the fingertips of the participant to measure oxygen saturation and pulse rate (Huang et al., 2014; Kong et al., 2014). The participants laid down and rested for fifteen minutes.
At the start signal, the test performer stepped with the right foot onto the bench followed by the left foot. The test performer stepped up-up-down-down repeatedly within one minute with a prescribed beat per minute. After the step test performance, the data from the pulse oximeter, called the Exercise Pulse Rate (EPR), were recorded.
Determining the exercise intensity through the heart rate requires calculation involving the Maximum Heart Rate (MHR), HRR, RHR, and EPR. The Fox Equation may be the best choice for the general population since it is less likely to underestimate or overestimate dependent on individual HRmax values (Shookster et al., 2020). The exercise intensity was calculated using the Karvonen method (She et al., 2015).
Validity and Reliability
The validity of YMCA 3-minute step test was analyzed with Pearson test to determine the correlation coefficient between VO2max and YMCA 3-minute step test. Furthermore, the study (Van Kieu et. al., 2020) indicates that YMCA 3MST equation is a valid sub-maximal test for the prediction of maximum aerobic capacity.
The use of anthropometry measurement is widely used by some researchers and has proved its validity due to a series of examinations for its effectiveness (Dianat et. al., 2018). In this study, the use of tape measurement to measure the leg length from the anterior superior iliac spine (ASIS) to the medial malleolus using a measuring tape in unit centimeters was studied (Neelly etc., 2013). The result shows that the supine TMM (tape measure method) is a valid and reliable clinical measurement according to two physical therapists when measuring leg length compared to CT scan method.
Additionally, the weight was obtained using a digital weighing scale. The study (Kumar et al., 2014) shows DWSs have excellent reliability in static limb loading measurement. Similarly, measurements of digital weighing scale were in good agreement and held valid with measurements of MatScan.
For the pulse oximeter, its validity to get the heart of a person was assessed using a Bland-Altman analysis with bias, precision and limits of agreement (LOA) calculated with 95% confidence intervals (CIs) (Smith, 2019). Accordingly, low-cost, portable fingertip pulse oximeters are widely available to health professionals and the public. The US Food and Drug Administration (FDA) reported that the accuracy of prescribed pulse oximeter is highest at saturations ranging from 90–100%, while intermediate is 80–90% and lowest is below 80% (Brytanova et al., 2022). The data of their study were generated and analyzed using Statistical Package for the Social Sciences Software (IBM SPSS for Windows Inc., v. 26.0, Chicago, IL, USA).
This study utilized the test-retest reliability of the research instruments, which means that the 3-minute YMCA step test was conducted twice with the same participants. According to the study (Noble et al., 2021), test-retest reliability is a measurement theory concept that quantifies the stability of a measure under repeated measurements. Since this study is a descriptive correlation, data were statistically tested using Pearson correlation coefficient. The Pearson correlation coefficient (PCC) is defined (Zhou et al., 2016) as a statistical metric that measures the strength and direction of a linear relationship between two random variables.
Scoring Procedure
The premise for scoring procedure is outlined in this section, especially for the anthropometric measures (leg length and weight) and exercise intensity in HRR. Furthermore, the interpretation was added to lend some substance to the scores acquired throughout the data collection. In this study, the researcher conducted pilot testing to determine the leg length measures of the participants. In the pilot testing, the researcher noted the longest leg length measure and the shortest possible measure within the circle of participants only. Moreover, to ensure that gender differences are taken into consideration in the conduct of this study, gender-based classification was employed. The result of the pilot testing is as follows: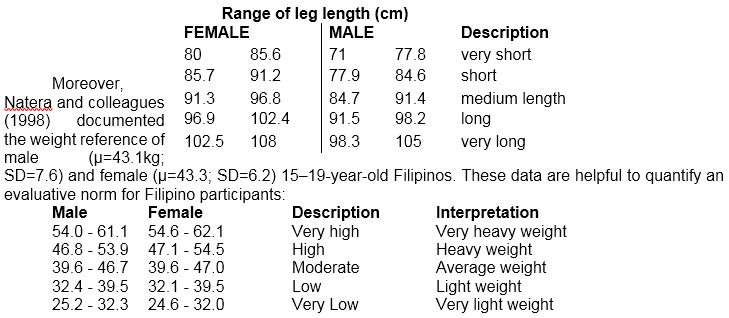
Adding to the evaluative norms is the assessment of the exercise intensity considering the Karvonen method (She et al., 2015):
| % Heart Rate Reserve | Exercise Intensity | Description |
| <20 | Very light Intensity | This level refers to steady heart rate and no noticeable change in breathing (Eather et. al. 2020). |
| 20-39 | Light Intensity | This level has an increase in respiration or heart rate is minimal or nonexistent. Throughout the activity, a person is able to communicate and sing (Singh et. al. 2019). This level is associated with lower disability and disease activity, as well as risk factors for cardiovascular disease, such as lower BMI and blood pressure (Khoja et. al. 2016). |
| 40-59 | Moderate Intensity | This level refers to raising the heart rate, breathing rate, and body temperature which would result to sweat secretion (Kim et. al. 2022). |
| 60-84 | Vigorous Intensity | This level is challenging and requires exertion. The intensity was frequently attributed to being so breathless that speaking at the same time is impossible (Hjalmarsson, 2023). |
| 85 | Maximum Intensity | This level is done "all-out" and maintained by an anaerobic ATP yield that is higher than that of oxidative metabolism (Saghiv et. al. 2020). This level has a lot of energy being released within a small period of time, and the oxygen demand surpasses the oxygen supply (Whitfield et. al 2014). |
Data Gathering Procedure and Ethical Consideration
Preparation and planning are vital, including the researcher's ethical obligations. The researcher complied with Lourdes College's Research Ethics Committee (LC-REC) requirements and recommendations and was then given the certificate of approval to conduct the study. This would ensure that ethical considerations from data collection were addressed.
School officials, supervisors, and administrators are highly respected. The researcher asked and requested for their approval before conducting the study through letters (see Appendix E). The participants were also given a participation request letter for the prior notice.
Participants were able to complete the limited face-to-face orientation and health preparedness screening for their health clearance. Then, they participated in cross-sectional data gathering through the anthropometric measurement process. The step test protocol was then determined through the exercise intensity. The researcher, together with the assistants, had recorded the scores of the participants.
The research has followed the LC-REC’s guidelines. The researcher had gathered the participants’ informed assent and parental consent form. Participation is optional. This means that participants were given a chance to ask questions and were told that they might decline or withdraw from the research without worry. Thus, the researcher did not devise a scheme to pressure, convince, or reward the participants. Participation of this study would not affect their grades or their academic standing whatsoever.
The researcher informed the participants of the nature and objectives of the study via letter (see Appendix B) and informed assent and consent forms (see Appendix D). The research assured the participants' safety and welfare by addressing hazards including physical exhaustion from activity. Participants were asked to complete the Physical Activity Readiness Questionnaire (PARQ) (see Appendix C) to further assess their readiness and to consider medical history. To guarantee everyone's safety, health risks were evaluated. The step test protocol had been demonstrated for the proper and safe performance of the protocol. Qualified assistants, with the collaboration of the school nurse, facilitated the testing process. Warm-ups and PE clothes were recommended, and water was also provided to prevent dehydration. The researcher worked with the school clinic and carried a first aid kit.
On top of that, the student participants are vulnerable age-wise. The LC-REC evaluated the methods to ensure that the strategies outlined are safe for the study's population and not exploitative. Data gathering was conducted in a participant-friendly manner by conducting an orientation first regarding with the intention of the researcher and letting them use their freewill to join or not.
Participants' data and privacy were respected. The Data Privacy Act (2012) protects the identities of schools, teachers, and study participants. Codes were used to conceal names and identify information on record. The researcher ensured that print or electronic data, including numeric, textual, audio, and video, were safely stored. Participants were also encouraged to retain confidentiality and not disclose their classmates’ information to others. Policies on video recording and sharing were being set in place.
The researcher provided the study's necessary resources, materials, equipment, and facilities. No participation fees or contributions were requested. The researcher was willing to refund unavoidable participant expenses.
Statistical Treatment
Descriptive statistics for this research comprise the computation of means and standard deviations according to the participants' leg length, weight, and exercise intensity. The frequency distribution method was also utilized to analyze the distribution of variables within the investigated population, enabling visualization of the extent and prevalence of different measurements. Ultimately, the crux of the statistical study resides in the regression analysis, which utilizes the predictive variables—leg length and weight—to determine the cumulative influence of the outcome variable – exercise intensity. The factors representing leg length and weight in this model provide insights into the characteristics and magnitude of their correlation with exercise intensity. The statistical significance of each coefficient was assessed using a t-test to determine if the observed associations are meaningful and not just coincidental.
Chapter 4
PRESENTATION, ANALYSES, AND INTERPRETATION OF DATA
This chapter presents the analyses of the statistical results of the data and its interpretation. The discussion of the results conveys meaningful insights on the impact of leg length and weight on exercise intensity.
Problem 1: What are the participants’ leg length and weight measures?
In order to present the leg length and weight measures of the participants, this research employed gender-based classification for presentation. Table 1 presents the frequency and mean distribution of leg length measures of female participants.
Table 1 Frequency and Mean Distribution of Leg Length Measures of Female Participants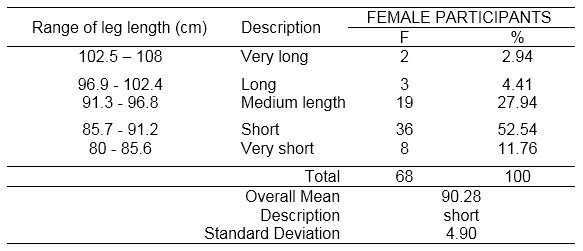
Overall, the female leg length was recorded as 90.28 cm interpreted as “short” with a standard deviation of 4.90 cm. From the table, it can be gleaned that female participants' leg lengths ranged from an extremely short eighty centimeters (80 cm) to an extremely long hundred and eight centimeters (108 cm). Thus, this result is essential for comprehending their step test performance and level of difficulty.
Table 2 Frequency and Mean Distribution of Leg Length Measures of the Male Participants
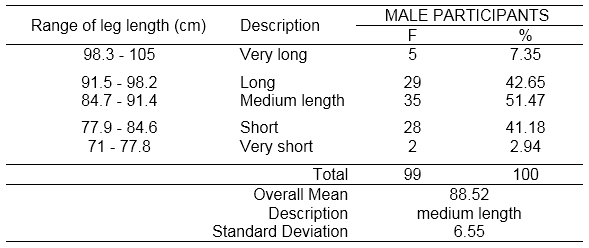
Table 2 shows the frequency and mean distribution of leg length measures of the male participants. The average leg length was documented as 88.52 cm, which corresponds to the category of "medium length." A substantial dispersion in the leg length measurements among the participants was indicated by the 6.55 cm standard deviation for this group. From the table, the leg lengths exhibited a wide spectrum, spanning from an exceptionally short seventy-one centimeters (71 cm) to extremely lengthy hundred and five centimeters (105 cm).
Table 3 Descriptive and Frequency Distribution of Weight Measures of Female Participants
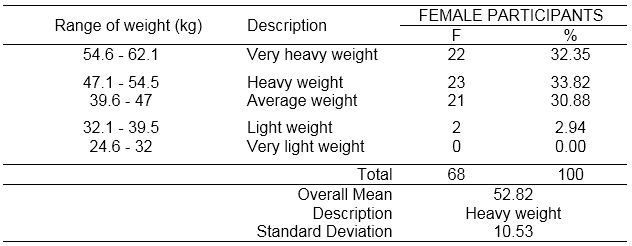
Tables 3 illustrates the descriptive and frequency distribution of weight measures of the female participants. As a whole, the mean weight was 52.82 kg, which was classified as “heavy”. The calculated standard deviation of 10.53 kg suggests that there is a substantial degree of variability in the weight of the female participants which means that the data largely vary from each other; some exceeded too far from the ones from “light weight” category. From the table, there were no female participants classified as “very light weight”. With a total of sixty-eight (68) female participants, the weight distributions are: “light weight” (2.94 percent), “average weight” (30.88 percent), “heavy weight” (33.82 percent), and “extremely heavy weight” (32.35 percent). Given that weight represents a gravitational attraction force, the results indicate that the majority of the female participants are heavily weighted, indicating that they have greater gravitational force (Liu & Fang 2016; Sarabando et al., 2016).
Table 4 Descriptive and Frequency Distribution of Weight Measures of the Male Participants
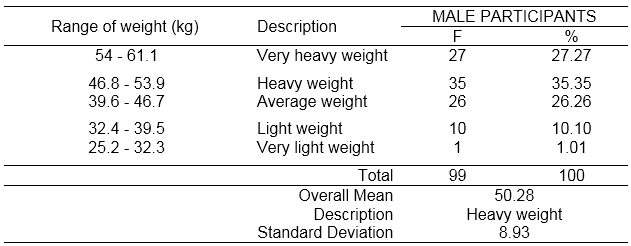
In contrast, Table 4 presents the descriptive and frequency distribution of weight measures of male participants, revealing a broad spectrum of measures ranging from extremely light (25.2 kg) to extremely heavy (61.1 kg). The group had a mean weight of 50.28 kg, which places them in the category of “heavy weight.” The male participants had a moderate degree of weight variation, as seen by the standard deviation of 8.93 kg. The ninety-nine male participants are having the following weight categories: “very light weight” (1.01 percent), “light weight” (10.10 percent), “average weight” (26.26 percent), “heavy weight” (35.35 percent), and “very heavy weight” (27.27 percent). These findings imply that one of the things that makes a person to exert more force in the opposite direction to raise their body is their weight (Lee et al., 2013) which means that they have more gravitational force (Liu and Fang 2016) since weight is the gravitational attraction force of the body (Sarabando et al., 2016).
Based on the descriptive data presented, records show notable discrepancies in weight classifications among the participants. Sardinha and team (2014) suggest that schools reinforce more physical activities for the students to improve their cardiorespiratory and weight status. These effects are shaped by a variety of individual, cultural, and societal elements (Azagba et al. 2014).
Problem 2: What is the level of the participants’ Exercise Intensity measure after 3 minutes step test performance?
Table 5 reveals the frequency and mean distribution of the female participants’ exercise intensity after a 3-Minute Step Test. In general, the group's average exercise intensity was calculated with the mean of 58.45 interpreted as “moderate.” This was accompanied by a standard deviation of 10.64. From the table, the varying degrees of intensity of female participants is from "Very Light Intensity" to "Maximum Intensity." Specifically, a total of 1 percent of the participant was labeled as “Light Intensity” and “Maximum Intensity”. A significant proportion of the participants with 57.35% indicated an intensity level classified as “Moderate Intensity” during their activity, whereas 39.71% characterized their workout as “Vigorous Intensity”. These results indicate that the participants encountered a moderate degree of variance in their intensity levels as manifested in the increase of their heart rate, breathing rate, and body temperature, which resulted to more sweat secretion (Kim et. al. 2022).
Table 5Descriptive and Frequency Distribution Table of the Female Participants’ Exercise Intensity after a 3-Minute Step Test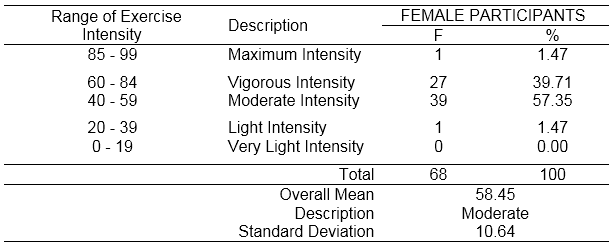
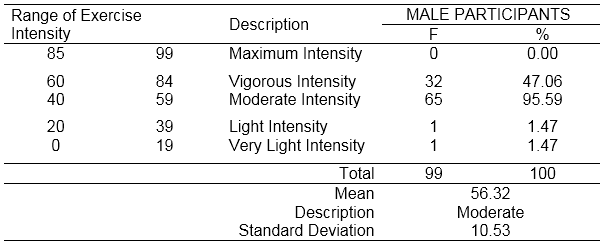
In table 6, frequency and mean distribution of the male participants’ exercise intensity after a 3-Minute Step Test was presented. On average, the mean intensity of the exercises performed by males was deemed "Moderate" at 56.318. The standard deviation of 10.53, which shows a moderate dispersion of the male participants' intensity levels, offers insight into how they performed the Exercise Intensity under their physical capabilities. The level of severity varied between "Very Light Intensity" and "Maximum Intensity." It is worth noting that a mere 1.47 percent of the male participants exhibited intensity levels classified as both “Very Light Intensity” and “Light Intensity”. The majority, 95.59 percent had an intensity categorized as “Moderate Intensity”, while 47.06 percent indicated to have a “Vigorous Intensity.” None of the male participants fell into the “Maximum Intensity” category. With such moderate level of exercise intensity, the participants experienced an increase in heart rate, breathing rate, and body temperature, leading to the release of sweat secretion (Kim, et. al. 2022).
Table 6 Descriptive and Frequency Distribution Table of the Male Participants’ Exercise Intensity after a 3-Minute Step Test
The Exercise Intensity statistics presented in both Tables 5 and 6 provide significant insights into the participants’ physical activity regimen. Mainly, the moderate to vigorous exercise intensities were more common among them, indicating that individual endurance and strength significantly influence exertion. This means that participants may have experienced a gradual disruption in their homeostasis, affecting their ability to meet the energy demands during their activities. (MacIntosh et al., 2021). This finding is consistent with the perspectives presented by She and colleagues (2015) and Wolpern and colleagues (2015), highlighting the significant variation in the way people physically respond to different levels of physical exercise, particularly when it comes to factors like age and body mass index.
Additionally, the study highlights the significance of tailoring exercise intensity to accommodate a variety of fitness levels and lifestyle constraints. (Hwang et al., 2022; Kawae et al., 2022). The notable proportion of participants who reported moderate intensity suggests a possible emphasis on finding a balance between the effectiveness of exercise and the safety and capabilities of the individuals involved, considering the concerns raised (Myllymaki et al., 2012) regarding the potential hazards associated to high-intensity workouts in particular health conditions.
Problem 3: Do the participant’s leg length and weight significantly influence their exercise intensity?
Ho1: Leg length and weight do not have significant influence on the level of the participants’ exercise intensity after 3-minute step test.
Table 7 Regression Analysis of the influence of Leg Length and Weight on Exercise Intensity in Participants Performing the 3-Minute Step Test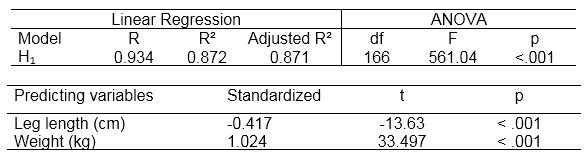
The Table 7 presents the result of the Regression and Coefficient Analysis of the influence of Leg Length and Weight on Exercise Intensity in Participants Performing the 3-Minute Step Test. The data pointed out that the high correlation coefficient (R) of 0.934 in the linear regression model (H₁) indicates a positive association between leg length and weight and exercise intensity. Evidently, the R² value of 0.87 indicates that these two factors collectively account for around 87 percent of the variance in exercise intensity. The remaining 12.8 percent may be attributed to other factors such as the food intake on the day of fitness testing, the weight of the shoes they were using and the missing steps in following the proper rhythm of the metronome.
Additionally, the ANOVA (Analysis of Variance) outcome reinforces that the model is significant (F=561.04, P=.001). This indicates that there is no random variation in the effect of leg length and weight on exercise intensity. Thus, the null hypothesis is rejected. The analysis provides evidence that leg length and weight are substantial predictors of exercise intensity as measured by the 3-minute step test. The table also presents the influence of each predictor variables such as leg length and weight. Leg length has a standardized coefficient of -0.417, a t-value that is deemed highly significant at -13.63, and a p-value that is less than 0.001 which implies a significant inverse correlation between leg length and exercise intensity, suggesting that individuals with longer legs likely experience a decrease in exercise intensity.
In view of the foregoing, the observed inverse correlation between leg length and exercise intensity are corroborated by other scholarly works. For instance, Hazari and colleagues (2021) and Andersen and colleagues (2020) explained the Range of Motion concept, which stated that low-effort, high-accuracy operations require less range of motion. As a result, those with longer legs would typically spend less effort in comparison to those with shorter legs during the same quantity of physical activity, which would create the illusion of a lower intensity of exercise. O'Brien et al. (2018) also discovered that those with longer legs use less steps to attain the same intensityThe findings of Salamuddin et al. (2014) also suggested that leg length has a direct influence on the intensity of exercise.
Lastly, the standardized coefficient for weight is 1.024. This number is further supported by a t-value of 33.497 and a p-value that is <.001. This finding implies a positive influence between body mass on exercise intensity, suggesting that participants who are relatively heavier have corresponding increase in the intensity of their workouts. This result may imply that the study of Meghan (2022) shows the same result which states that longer leg length have been linked with cardiometabolic health outcomes among the adults.
In relation to weight, Cava et al., (2017) found that persons who are overweight exhibit diminished muscle endurance and performance in weight-bearing exercises. Additional evidence to this effect comes from Lopes et al. (2019) and Liu (2011) who averred that those within the normal weight range exhibit superior performance across a range of physical fitness components in comparison to those who are overweight. Ding et al. (2020) discovered a correlation between elevated body mass index (BMI) and diminished cardiorespiratory endurance among males. Research (Raistenskis et al., 2016) has brought attention to the adverse health consequences associated with overweight and obesity in teenagers. The study reinforces the importance of creating personalized physical activities and interventions for overweight or obese individuals to enhance their fitness levels effectively. The study, therefore, confirmed the influence of weight on physical capacity.
Chapter 5
SUMMARY, CONCLUSION AND RECOMMENDATIONS
This chapter provides a comprehensive summary of the study's key findings, outlining the conclusions and recommendations derived from the analysis and interpretation of the data.
Summary
The Problem: The purpose of this study was to investigate the influence of leg length and weight on the exercise intensity in a fitness assessment setting, particularly in the 3-minute step test. The study operated within a theoretical framework that recognizes leg length and weight as significant variables affecting exercise intensity, based on biomechanical principles like Range of Motion and Ground Reaction Force. It sought to answer how these individual physical attributes—leg length and weight—correlate with the exercise intensity as experienced during the step test.
There are research questions that are formulated in order to explicitly show the gathered data and how it is being interpreted. The participants’ leg length and weight are being gathered to get the level of participants’ exercise intensity after the 3-minute step test performance. The influence of each variables as well is being investigated if it has been influencing the exercise intensity of the participants.
Method: The research employed a descriptive correlational design in an effort to clarify the connection between the variables that were defined. A random sample strategy was utilized in the study in order to reduce bias and improve dependability. Approximately 167 pupils or 90 percent of the population were represented in the sample in order to preserve gender proportionality. Weight and leg length (from the anterior superior iliac spine to the medial malleolus) were determined using this technique (using a digital weighing scale). A modified step test technique was used in accordance with the YMCA 3-minute step test recommendations. The emphasis is on utilizing heart rate changes to quantify workout intensity. The categorization of participant leg length and weight was determined using the outcomes of pilot testing for leg length and pre-existing reference data for weight. The intensity of exercise was evaluated utilizing the Karvonen method (percent Heart Rate Reserve). Furthermore, the process of data collecting was conducted in strict adherence to the ethical norms established by the Research Ethics Committee of Lourdes College (LC-REC). Descriptive statistics such as the mean and standard deviation were employed in the study, along with frequency distribution and regression analysis utilizing t-tests.
Findings: The results of this investigation with exercise intensity indicated that both male and female individuals engaged in moderate levels of exertion, with a greater incidence of moderate to difficult exercise intensity among the males. The male participants had a “medium” leg length, while the female individuals possessed a "short" leg length. The average mean of body mass of males and females was "heavy weight." There was an influence of leg length and weight on exercise intensity among participants completing the 3-minute step test. The study highlights the potential for longer-legged individuals to engage in equivalent physical activity with reduced effort, potentially enhancing the intensity of the exercise. Exercise intensity tends to diminish as leg length increases and there was a rise in weight corresponds to an increase in exercise intensity.
Conclusion
The purpose of this research endeavor was to examine the influence of leg length and weight on the intensity of exercise performed by individuals during a three-minute step test. Drawing upon biomechanical principles such as Ground Reaction Force and Range of Motion, the objective of this study was to promote empirical data regarding the impact of anthropometric variables on physical exertion. The implications of the study's results are substantial in practical settings, specifically within the domains of Physical Education (PE) courses and fitness assessment situations.
The results of the study were significantly influenced by theories such as the Range of Motion principle, which states that low-effort actions require a shorter range of motion, and the Ground Reaction Force concept, which establishes a relationship between body mass and the force applied against the ground. These theories provided explanations to confirm the result of the study. For the phenomenon where individuals with longer legs experienced reduced exercise intensity because of biomechanical advantages such as longer stride lengths. Conversely, individuals with higher body weight perceived increased exercise intensity due to the heightened effort needed to maintain their body mass and movement.
These discoveries hold significant practical implications for fitness practitioners and PE instructors. They emphasize the significance of taking individual physical characteristics into account when planning exercise regimens or conducting fitness evaluations. For example, by recognizing that students who have a greater body mass index may view physical activity as more strenuous. This then calls for instructors to tailor activities that are not only effective but also more suitable for these individuals. However, it is also critical to keep in mind that, in addition to leg length and weight, which determine exercise intensity, other interrelated factors like a person's age, health, diet, and medical history may also have an impact on their EPR. These other elements might potentially help to define or explain the potential intensity level of an individual.
This research emphasizes the need for fitness assessment techniques that consider individual differences and needs in leg length and weight, ensuring impartial evaluations for every student. Hence, the study emphasizes the importance of an individualized approach in physical education and fitness evaluations, advocating for methodologies that value diverse physical characteristics, fostering equity, inclusiveness, and fostering a constructive environment for fitness assessment and physical education.
Recommendation
Based on the findings, the following are recommended:
1. Physical Educators may modify exercises or step test protocols to address discrepancies such as the one-size-fits-all type of fitness test which is apparently not suitable to those students who cannot reach the bare minimum of a step height, in order to ensure the accurate and fair evaluation of each student's fitness level.
2. Athletic Coaches may facilitate effective training without causing unnecessary strain or danger of damage to athletes with varied body types, this may involve adjusting training intensity, step height in drills, or endurance activities.
3. Fitness Instructors may develop training regimens that accommodate the needs of each client considering the individual differences, guaranteeing the tasks remain both strenuous and attainable, irrespective of leg length or body mass.
4. Physical Education Learners may design an individualized training program in their own field of specialization by reconsidering their uniqueness and utilizing it as their basis to develop a more specific and clear goals and objectives.
5. Curriculum Developers may contextualize pedagogical resources that instruct students on the physiological and biomechanical ramifications of leg length and weight in relation to physical fitness. They may also establish methods in modifying step test in accordance with leg length and weight in order to have safety and equitable evaluation of cardiorespiratory endurance among the students.
6. Future Researchers may conduct safety measures in gathering the data by reconsidering the anthropometric measures that involves leg length and weight in their study. The findings may be used in their literature that would support the assumption of their studies in any relation to Newton’s Third Law of Motion that requires the leg length and weight in applying to forces.
Comments